
. TSLA at a Decision Point: The Levels That Decide the Next Big Move
. TSLA at a Decision Point: The Levels That Decide the Next Big Move
6/3/20262 min read
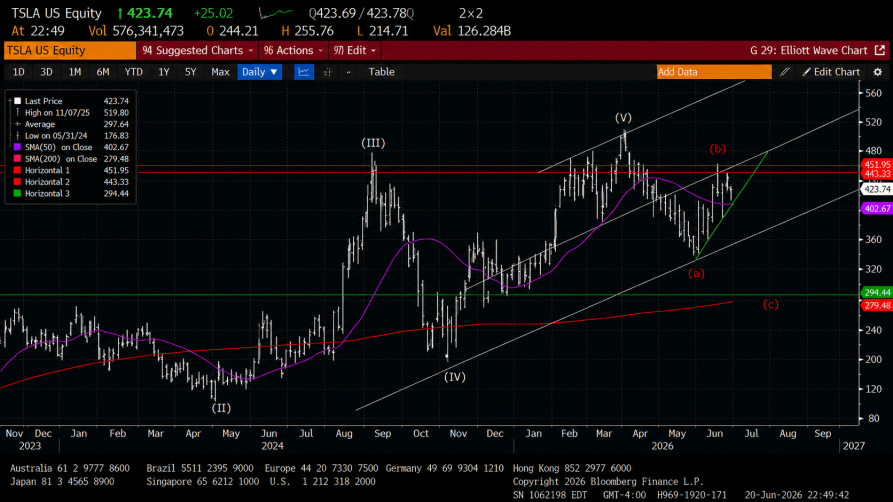
The short-term chart is still damaged. TSLA already rallied into the major 443–452 resistance zone and failed more than once. That area may have already marked the corrective rally failure zone. But we cannot confirm a larger bearish roadmap unless TSLA breaks the weekly support structure and starts closing below the key support area. The current inflection zone is roughly 420–430.38.
While TSLA trades inside that range, the stock is essentially undecided. It has reclaimed some high-volume structure intraday, but it has not cleared the level needed to flip the chart back into a stronger bullish repair phase.
The main bullish trigger is 430.38. If TSLA reclaims and holds above 430.38, the chart can push toward 435.84, then 439.10, with the larger resistance zone still sitting near 443.33–451.95. If TSLA reaches that zone again and fails, that would become a more important higher-timeframe rejection setup.
On the downside, the first warning comes below 419.46. If that level fails, the recent reclaim of the high-volume node starts to weaken. Below 416.21, sellers gain more control, and TSLA can retest the recent low near 413.30. A break below 413.30 would put the weekly trendline support under serious pressure.
The larger weekly sell signal would likely come on a decisive break or weekly close below the 408–413 support zone. If that happens, the bullish hammer / trendline defense thesis weakens materially, and downside targets around 403, then 392.77, become much more realistic. For now, the A-B-C corrective roadmap remains a risk scenario, not the active base case.
A larger wave-C style decline would imply a break below the rising two-year support structure, which is a major event. That is possible, but it should not be assumed until price actually confirms it. The trading plan is simple: calls are cleaner only above 430.38 with a hold, while puts are cleaner on a failed reclaim of 424–426 or a clean loss of 419.46 / 416.21. In the middle of the range, TSLA is likely to remain choppy and difficult.
Bottom line: TSLA is not fully bullish yet, and it is not fully broken yet. The weekly trendline is still holding, but the stock has failed multiple times near major resistance. This is a true inflection point. The best edge is not predicting too early — it is waiting for TSLA to leave the range and then trading the confirmed side.
Help
Questions? Reach out anytime here
Contact
Subscribe TO WEEKLY NEWSLETTER
support@daytradersgroup.com
© 2026. All rights reserved.