672.50 Holds The Key | S&P 500 Technical Analysis
The current structure in SPY presents a highly organized and technically significant inflection point, where multiple layers of price behavior are converging into a decisive moment. Price is...
SPY PRICE FORECAST
3/18/20263 min read
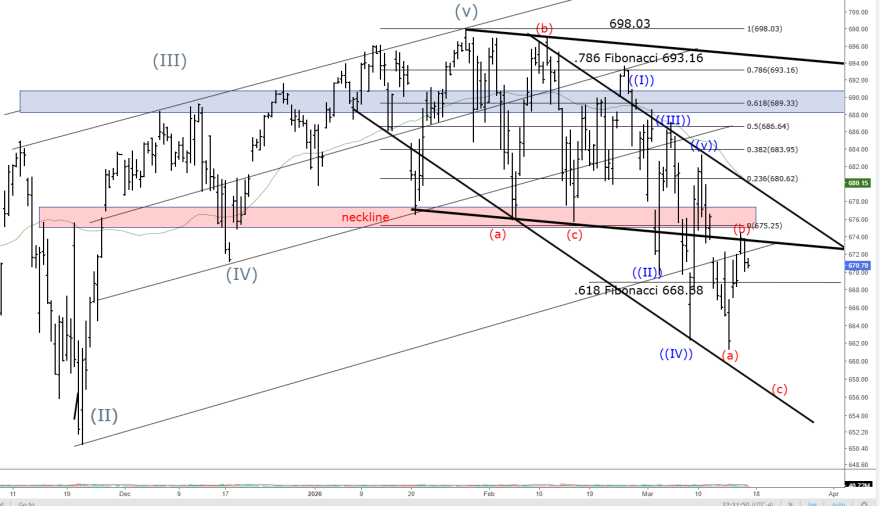
The current structure in SPY presents a highly organized and technically significant inflection point, where multiple layers of price behavior are converging into a decisive moment. Price is no longer trending cleanly in one direction, but instead compressing within a descending wedge formation while simultaneously interacting with a clearly defined horizontal neckline resistance near the 674 to 676 region.
This combination of diagonal compression and horizontal supply defines what can best be described as a decision node, where the next directional move is unlikely to be gradual and instead resolves with expansion. From a structural standpoint, the broader context suggests that the market has already completed a five wave decline into the recent lows, labeled as wave four in your framework.
What is unfolding now appears to be a corrective phase, characterized by overlapping price action and progressively lower highs pressing into resistance. This behavior is not indicative of strength, but rather of supply reasserting itself at increasingly lower levels. The descending trendline acts as dynamic resistance, while the neckline around 675 represents former support that has now transitioned into a supply zone.
This role reversal is critical, as it reflects a shift in order flow where prior buyers may now be positioned to sell into rallies. The confluence at the 674 to 676 region is therefore not arbitrary. It represents the intersection of the descending wedge resistance, the neckline of the prior breakdown, and the psychological anchoring of recent price memory. As long as price remains beneath this zone on a closing basis, the burden of proof remains on buyers, and the prevailing expectation is for continuation lower.
A failure to reclaim this region with acceptance reinforces the interpretation that the current move is corrective rather than impulsive. The bearish scenario is therefore defined with precision. Below 674, and more importantly upon rejection within the 674 to 676 resistance band, the probability favors a continuation move toward the 0.618 retracement near 668.68.
This level serves as the first logical target, not only because of its Fibonacci significance, but also due to its alignment with prior structural interaction. A sustained move below this level opens the path toward the 662 to 660 region, which represents both a measured move projection from the wedge and a zone of prior liquidity. Should downside momentum accelerate, the lower boundary of the broader channel near the mid 650s becomes a viable extension target. Risk in this scenario is clearly defined by a sustained move back above 676.5 on a closing basis, which would invalidate the immediate bearish thesis.
The bullish scenario, while secondary in probability at present, must be respected due to the nature of compression patterns. A breakout above 676 that is accompanied by acceptance, rather than a transient wick, would signal that supply has been absorbed. In such a case, the wedge structure resolves upward, often leading to sharp short covering as trapped sellers are forced to exit positions. The initial upside target in this scenario is 680, followed by 683 and then 686, each corresponding to prior areas of supply and intermediate structural pivots. The key distinction here is that the move must demonstrate continuity above the neckline, as false breakouts are common in wedge environments.
It is important to emphasize that the current environment is not conducive to chasing price within the range. The region between approximately 670 and 674 represents a zone of diminished edge, where overlapping price action reflects equilibrium rather than opportunity. The highest probability outcomes occur at the boundaries, specifically at resistance rejection or breakout acceptance. This is where risk can be tightly defined and reward can be asymmetrically captured.
What makes this setup particularly compelling is the clarity of its structure. The market is effectively presenting a binary framework, where defined levels dictate behavior and outcomes. Rather than attempting to predict direction prematurely, the disciplined approach is to allow price to confirm its intent at these critical thresholds. In doing so, one aligns with the underlying order flow rather than attempting to anticipate it. In conclusion, the path forward is governed by two primary triggers.
Bearish below 674, particularly on rejection within the 674 to 676 resistance zone, targeting 668.68 followed by 662 to 660 and potentially the mid 650s.
Bullish above 676 with confirmed acceptance, targeting 680, 683, and 686. The structure is mature, the levels are precise, and the compression suggests that resolution is imminent. The opportunity now lies not in prediction, but in disciplined execution as the market reveals its next move.
Help
Questions? Reach out anytime here
Contact
Subscribe TO WEEKLY NEWSLETTER
support@daytradersgroup.com
© 2026. All rights reserved.