My SPY Trade Plan: Key Levels, Triggers, and the Most Likely Path After Friday’s Late Day Reversal
The market closed the week with a decisive shift in tone, as sustained selling pressure throughout the week finally reached a short term exhaustion point late Friday.
SPY PRICE FORECASTS&P PRICE FORECASTSTOCK MARKET FORECAST
3/21/20262 min read
The market closed the week with a decisive shift in tone, as sustained selling pressure throughout the week finally reached a short term exhaustion point late Friday.
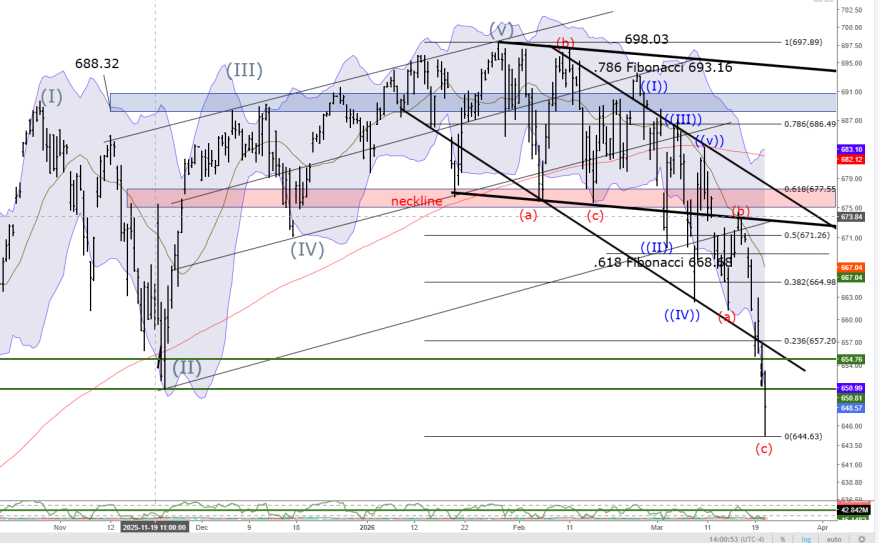
On the daily chart, price completed a clean move through the lower boundary of the descending structure and briefly pierced into the 644.63 area before sharply reversing. That late session move from 644.74 to 655.28 was not random strength.
It carried the signature of short covering into OPEX, where extended positioning and compressed downside momentum forced a reflex bid. Despite that rebound, the broader daily structure remains bearish, with price still trading below the neckline zone near 674 to 677 and under declining resistance.
The weekly chart reinforces this view, showing a loss of momentum after a prolonged advance, with price now interacting with the rising 20 week moving average and momentum indicators rolling over from elevated levels. This places the market in a corrective phase rather than a confirmed reversal higher.
On the intraday 30 minute chart, the breakdown into 644.74 followed by a sharp reclaim back above 653.50 establishes a key battleground for the next session. The most important trigger on the upside is a sustained move back above 656.15, which would confirm that the late day reversal was more than just a temporary unwind and opens the path toward 660.80, followed by a test of 664.98 and potentially 668.68 where the 0.618 retracement and prior supply converge.
However, if price fails to hold above 653.50 and loses that level on a closing basis, it would signal that the bounce was purely mechanical and reintroduce downside pressure toward 647.31 and then 644.63, with a break there exposing the 640 region as the next liquidity target.
The most likely path forward into early next week is a continuation of this two sided behavior, with an initial attempt to build on the short covering bounce followed by a test of overhead supply. Unless price can reclaim and hold above the 668 to 674 region, rallies are expected to remain corrective and vulnerable to failure within the broader downtrend.
Help
Questions? Reach out anytime here
Contact
Subscribe TO WEEKLY NEWSLETTER
support@daytradersgroup.com
© 2026. All rights reserved.