
SPY closed the week at 746.74, sitting directly on top of the short-term moving average cluster,
SPY closed the week at 746.74, sitting directly on top of the short-term moving average cluster
6/19/20262 min read
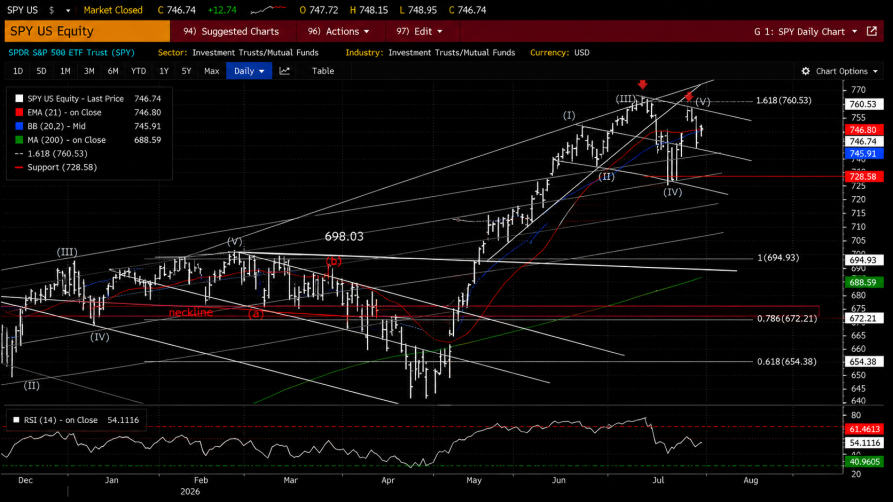
SPY closed the week at 746.74, sitting directly on top of the short-term moving average cluster, with the 21-day MA near 746.80 and the Bollinger midline near 745.91.
That makes the 745-747 zone the main decision area for the week ahead. Price is still holding above the prior breakdown level at 728.58, but the structure is no longer cleanly bullish. The chart shows a sharp rally into the 760.53 extension, followed by rejection, lower highs, and a developing compression pattern between the descending upper channel and rising lower support.
In plain English, the market is still elevated, but momentum is no longer expanding cleanly. The expected weekly range is roughly 728.58 to 760.53, with the more active trading range likely between 733-735 support and 755-760 resistance. A sustained move above 748-750 would favor a push back toward 755, then 760.53, where sellers previously stepped in.
Above 760.53, SPY would be attempting to reclaim expansion momentum, and the next move could squeeze higher as bears are forced to cover. But until price clears that zone with authority, the 755-760 area remains major supply.
The bullish trigger is a hold above 745.91-746.80, followed by a reclaim of 748-750. If that happens, calls can be considered on confirmation, with targets at 755, then 760.53. A clean daily close above 760.53 would shift the chart back into breakout mode and likely opens the door toward a fresh high attempt. Bulls do not want to see price lose the 21-day and mid-Bollinger cluster, because that would turn the same area from support into resistance. .
The bearish trigger is a failure below 745-746, especially if SPY loses the current daily low area near 743.95. Below that, the first downside targets are 738-735, then the rising lower channel area around 733. If 733 fails, the bigger line is 728.58. That is the major breakdown trigger on this chart
A daily close below 728.58 would confirm that the recent bounce failed and likely opens the door toward 724, 716-710, then the larger retest zone near 698-695. The RSI is sitting near 54, which is neutral and confirms the current message: this is not oversold, but it is also no longer in strong upside momentum. The previous RSI rejection near the red resistance line suggests upside momentum has cooled.
That means this week is less about chasing and more about waiting for the market to show whether 745-747 becomes support for another squeeze or whether it turns into the pivot where sellers regain control. For the week ahead, the cleanest play is simple: bullish above 748-750 for 755 and 760.53, bearish below 743.95-745 for 738-735, then 728.58. The bigger institutional read is that SPY is trapped between a failed extension high and a still-intact higher support structure.
As long as 728.58 holds, the bulls can argue this is controlled consolidation. If 728.58 breaks, the chart shifts from consolidation into distribution, and the lower targets become much more realistic. Also, boss, definitely check the weekly pivots before finalizing entries because this chart is sitting right in a zone where weekly pivot confluence could decide whether the first move is a fakeout or the real trade
Help
Questions? Reach out anytime here
Contact
Subscribe TO WEEKLY NEWSLETTER
support@daytradersgroup.com
© 2026. All rights reserved.