
SPY Gamma Plan: 755 Call Wall in Focus
SPY Is Pressing Into the Call Wall, But the Risk Map Is Getting More Fragil
S&P PRICE FORECASTTECHNICAL ANALYSIS
5/29/20264 min read
SPY Is Pressing Into the Call Wall, But the Risk Map Is Getting More Fragile
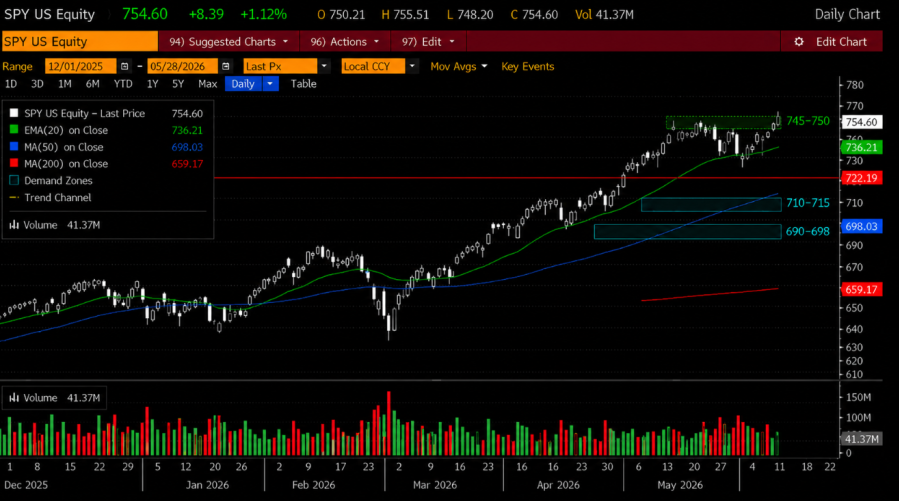
SPY is now trading near 754.60, pressing directly into the upper boundary of the short-term advance while the options market is showing a very important structure: the call wall is 755, the put wall is 750, and the gamma flip is 746.40. That means the market is operating in a positive-gamma regime above 746.40, where dealer positioning tends to dampen volatility and support controlled, grinding price action. In plain English, the structure still favors the bulls as long as SPY remains above the gamma flip, but the upside is now running into the most important options resistance zone on the board.
The key tactical level is 755. That is not just a round number. It is the call wall, and price is sitting almost directly underneath it. When SPY trades into a call wall after a strong multi-week rally, the first test often behaves like a magnet and resistance level at the same time. Buyers may be able to push price into that zone, but if dealers are short upside exposure or if call sellers defend the strike, SPY can stall, chop, or pin just below it. That is why buying calls blindly at 754 to 755 is not my preferred entry. The market has already traveled into the wall.
If SPY clears 755 and holds, the next upside targets remain 758 to 759 and then 764.04. But if price rejects the upper trendline and loses 750, the RSI divergence becomes actionable rather than theoretical. Below 746.40, the gamma regime shifts and the divergence could resolve into a faster downside move toward 743, 740, and eventually the 736 daily 20 EMA zone.
The bullish case requires a clean push and hold above 755. If SPY can reclaim 755 with strength and avoid immediately losing it, the next upside target becomes 758 to 759, followed by the larger Fibonacci extension near 764.04. That 764 level is the next major upside magnet on your daily chart, but it should be treated as a stretch target, not the base case unless momentum expands decisively. The first job for bulls is simple: convert 755 from resistance into support.
The bearish or cautionary case begins if SPY fails at 755 and loses 751.15 to 750. our chart shows price grinding just beneath the rising upper channel line, with the shorter-term moving average near 751.15. That makes 751 to 750 the first real support band. A shallow pullback into that zone would still be normal. But a break below 750 would matter because it would place price below the put wall and begin shifting attention toward the high-volume shelf and intraday structure below.
The next support zone is 746.40, which is the gamma flip. This is the line where the character of the market can change. Above 746.40, dips are more likely to be absorbed, volatility tends to stay contained, and rallies can continue in a controlled grind. Below 746.40, the market risks moving into a negative-gamma environment, where dealer hedging can amplify downside instead of stabilizing it. That is why 746.40 is not just another support level. It is the structural risk line.
Below the gamma flip, the downside path opens toward 743, then 740, and then the larger support shelf around 738 to 736. The daily 20 EMA is near 736, which gives that area additional significance. If SPY loses 746.40 and cannot quickly reclaim it, I would expect traders to start targeting the daily 20 EMA zone. A move there would still be a normal reset within the broader uptrend, but for short-dated calls it would be painful.
The daily chart remains objectively strong. SPY is above the 20 EMA near 736, the 50-day near 701.67, and the 200-day near 678.08. That means the larger trend is still bullish, and shorting purely because price “feels too high” is not enough. However, the daily RSI is around 73, and the MACD histogram is showing fading upside momentum even as price continues higher. That is not an immediate sell signal, but it is a warning that upside momentum is becoming less efficient.
The divergence is the important nuance. Price has continued to make higher highs, but momentum is not expanding with the same force. That usually means one of two things: either the market is consolidating internally before another push higher, or it is setting up for a pullback once the final breakout buyers are exhausted. Given the call wall at 755, this is exactly where I would become more selective with new long exposure. The 5-minute and 15-minute charts also argue against chasing. SPY has been riding a rising channel beautifully, but price is now sitting near the upper half of that channel. The better long entries came from the reclaim of 750 and the hold of the rising channel support.
Buying calls now is no longer buying strength from support. It is buying into resistance with RSI elevated and gamma resistance directly overhead. My play for tomorrow would be conditional. If SPY opens above 755 and holds that level on a 5-minute candle, I would consider calls with targets at 758, 759, and then 764 if volume expands. But if SPY opens near 754 to 755 and fails to break higher, I would not chase. I would wait for either a pullback into 751 to 750 that holds, or a clean breakout above 755 that confirms buyers are still in control. For puts, I would not front-run the short while SPY is above 751 and positive gamma remains intact.
The first real put trigger is a failed push at 755 followed by a break below 750. The higher-confidence bearish trigger is a loss of 746.40. Below that level, the market structure shifts, and downside toward 743, 740, and 736 becomes more realistic. So the thesis is straightforward: SPY is bullish, but extended. The market is pressing directly into the 755 call wall, and that makes this a poor place to chase calls without confirmation. Above 755, bulls can extend toward 758 to 764. Below 750, the rally begins to lose short-term structure. Below 746.40, the risk map changes materially and downside acceleration becomes more plausible.
Disclaimer: Not Financial Advice: All trade alerts, commentary, and messages provided through our stock analysis posts are strictly for informational and educational purposes only. Nothing shared should be considered personalized financial, investment, or trading advice. Independent Decision-Making: You are solely responsible for your own trading decisions. It is your duty to assess the suitability and risk of any trade based on your individual financial situation, objectives, and risk tolerance.
Help
Questions? Reach out anytime here
Contact
Subscribe TO WEEKLY NEWSLETTER
support@daytradersgroup.com
© 2026. All rights reserved.