SPY Rejects $642: Let's Talk About The Volatility Trap
The current market environment for the S&P 500 represents a textbook study in Negative Gamma Exposure and structural breakdown
3/28/20262 min read
SPY Rejects $642: Let's Talk About The Volatility Trap
The current market environment for the S&P 500 represents a textbook study in Negative Gamma Exposure and structural breakdown. As price action decisively violates multi-month support shelves, the interplay between the VIX and specific dealer hedging triggers serves as the primary mechanism for price discovery.
This heightened variance facilitates a path-dependency that drives extreme autocorrelation in downward price movement. Such a regime enables a state of extreme convexity, allowing for the realization of risk-adjusted returns and percentage gains that significantly outpace those achievable under standard mean-reverting or low-volatility conditions. The market is currently at a critical "Decision Pivot." The VIX has not only breached its previous daily high of 28.5 but has also exceeded the highs of the preceding four trading sessions, signaling a significant escalation in market fear and a breakdown of short-term volatility resistance.
This shift suggests that the "Fear Tax" is no longer diverging from price; rather, it is confirming the structural decay in the SPY. The bears are not exhausted; they are being fueled by a renewed demand for downside protection as primary technical levels fail to hold.
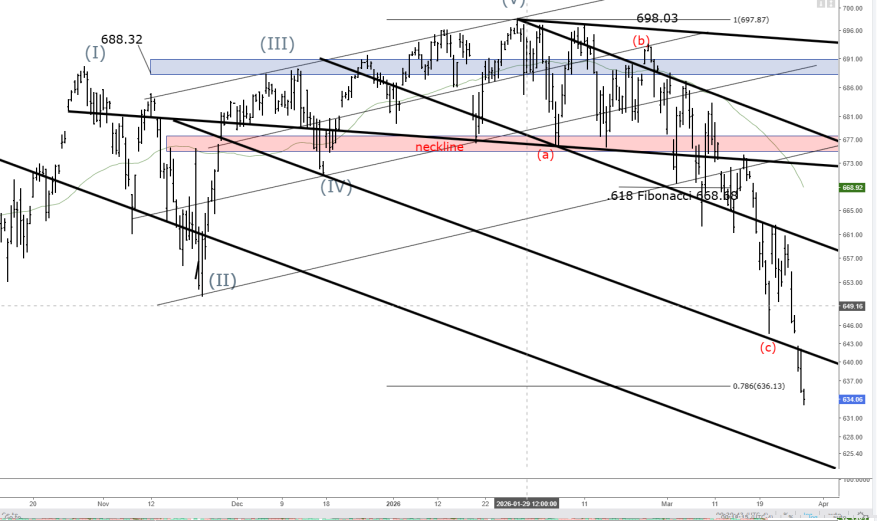
On higher-order timeframes, the index has decisively moved below its 200-day Simple Moving Average (SMA). This breach indicates that the long-term bullish trend is under significant duress, characterized by a persistent sequence of Lower Highs and Lower Lows. The technical narrative shifted today as SPY breached the critical $641.66 (S1) support level.
This zone, which previously functioned as a mechanical floor, has converted into formidable overhead resistance, confirming a transition from a "buy-the-dip" regime to a "sell-the-rip" structural environment. Downside Triggers & Liquidity Targets: If the current session low of $633.10 is violated on high volume, the "Negative Gamma Trap" will likely accelerate selling pressure as dealers are forced to sell into the weakness.
Next Downside Trigger: A sustained break below $631.00 = Primary Target: $626.63. Extreme Target: The .382 Fibonacci Retracement at $608.50, representing the "Ultimate Floor" on the weekly timeframe.
The Contrarian "Bull Case": The reversal thesis relies entirely on a "Short Squeeze" fueled by a massive put-call imbalance. With Max Pain situated at $660.00, dealers have a significant financial incentive to pull price higher if the $638.30 floor can be reclaimed and defended.
A 15-minute candle close above $641.25 = Upside Target 1: $644.72 (Descending trendline resistance). Upside Target 2: $655.27 (Pivot Point reclaim). In this environment, tactical patience is paramount. Shorts remain favored on retests of $641.50, while contrarian long positions only become viable upon a decisive reclaim of the $638.30 level, ideally supported by a VIX retracement below 28.50.
Help
Questions? Reach out anytime here
Contact
Subscribe TO WEEKLY NEWSLETTER
support@daytradersgroup.com
© 2026. All rights reserved.