SPY Technical Outlook: Key Levels After Today’s Momentum Move
Today’s trading session offered a clear reminder of how quickly momentum can develop when price interacts with well defined structural levels. Early in the session, SPY tested a major support zone near 662 and rapidly reversed higher.
3/9/20263 min read
Today’s trading session offered a clear reminder of how quickly momentum can develop when price interacts with well defined structural levels.
Early in the session, SPY tested a major support zone near 662 and rapidly reversed higher. That move created a sharp intraday rally toward the 672 area and produced a highly profitable options opportunity.
The $664 calls that were traded during the move delivered a gain of approximately 243 percent as the market transitioned from oversold conditions into a strong directional push. Such moves are not random. They occur when price moves away from a liquidity pocket and accelerates through a zone where positioning becomes imbalanced.
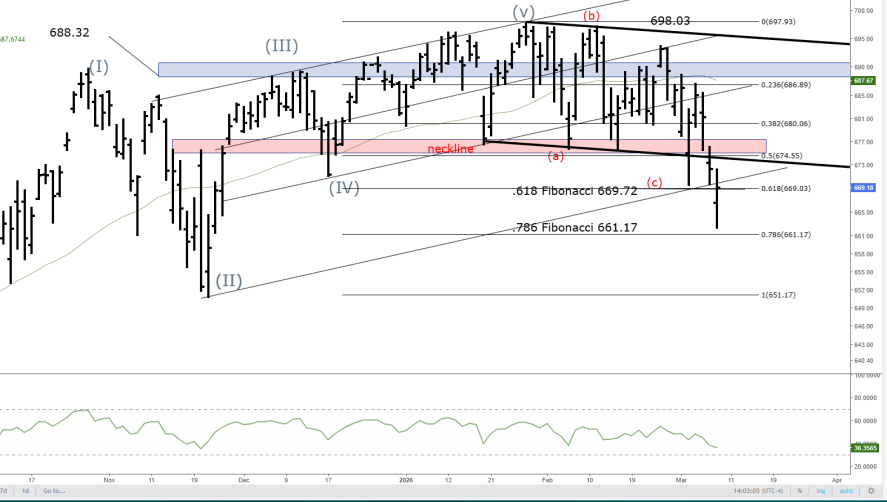
While the intraday rally was impressive, the broader technical context remains defined by the larger daily structure. The daily chart shows that SPY recently broke below a key neckline near the 674 to 676 area. That level had acted as structural support during the prior consolidation phase and once it failed, the market shifted into a corrective structure. The decline that followed pushed price toward the .618 Fibonacci retracement near 669.72, which served as the first meaningful reaction level.
Price briefly reclaimed that area intraday but ultimately failed to hold it, reinforcing the idea that the broader structure is still testing lower levels within the correction. The most important level on the chart remains the former support zone around 674 to 676. This region represents the neckline of the distribution pattern that formed during February. When markets break below a neckline and later rally back toward it, the underside often acts as resistance.
That dynamic was visible today when the rally stalled beneath the prior support band. For the market to regain bullish momentum, SPY would need to reclaim that zone and produce a sustained close above it. If buyers succeed in pushing price back above 672.75 and then reclaim the 674.78 to 676 area, the probability increases that the market will attempt a larger recovery toward 681 and potentially the 686 to 688 resistance region visible on the daily chart.
However, the market currently sits within a delicate balance between continuation and reversal. The next downside trigger remains the failure of the 667 region. That level aligns with intraday structure as well as the lower boundary of the consolidation zone that formed during today’s trading. A decisive break below 667 would open the path toward the next liquidity pocket near 665. Beneath that level, the daily chart shows relatively thin support until the .786 Fibonacci retracement near 661.17. If bearish momentum accelerates, the market could move quickly through the 665 level and probe the 661 area where buyers previously stepped in. From a structural standpoint, the most probable near term path is a continued test of the range between 667 and 672. Markets frequently compress within such ranges after a large intraday move while participants reposition. A break above 672.75 would represent the first bullish trigger and would likely lead to a test of 674.78 followed by the neckline zone near 676. Conversely, a failure below 667 would represent the bearish trigger and would shift focus toward 665 and potentially the deeper support cluster near 661.
Momentum indicators reinforce the importance of these levels. The daily RSI has rolled over from its prior highs and currently sits in the mid range, indicating that the market has room to move in either direction depending on which trigger level breaks first. Intraday charts also show declining momentum after the rally into 672, suggesting that the next directional move will likely be determined by whether buyers can reclaim overhead structure or whether sellers regain control beneath the current range. The key takeaway from today’s session is that the market continues to respect structural levels with remarkable precision. The morning reversal from the 662 region created a powerful rally that rewarded disciplined entries, while the rejection near 672 confirmed the importance of the overhead resistance zone.
As the market moves into the next session, traders should focus on the two defining triggers that will likely determine the next multi point move. A sustained move above 672.75 would shift momentum back toward the upside and target the 674 to 676 region. A decisive break below 667 would signal continuation of the correction and open the path toward 665 and potentially the deeper retracement level near 661. For now, SPY sits directly between these opposing forces. The next directional expansion will likely emerge once the market chooses which of these key levels to resolve.
Help
Questions? Reach out anytime here
Contact
Subscribe TO WEEKLY NEWSLETTER
support@daytradersgroup.com
© 2026. All rights reserved.