SPY Trading Plan: The Trendline Break Has Changed the Risk Map
SPY Trading Plan: The Trendline Break Has Changed the Risk Map
6/7/20262 min read
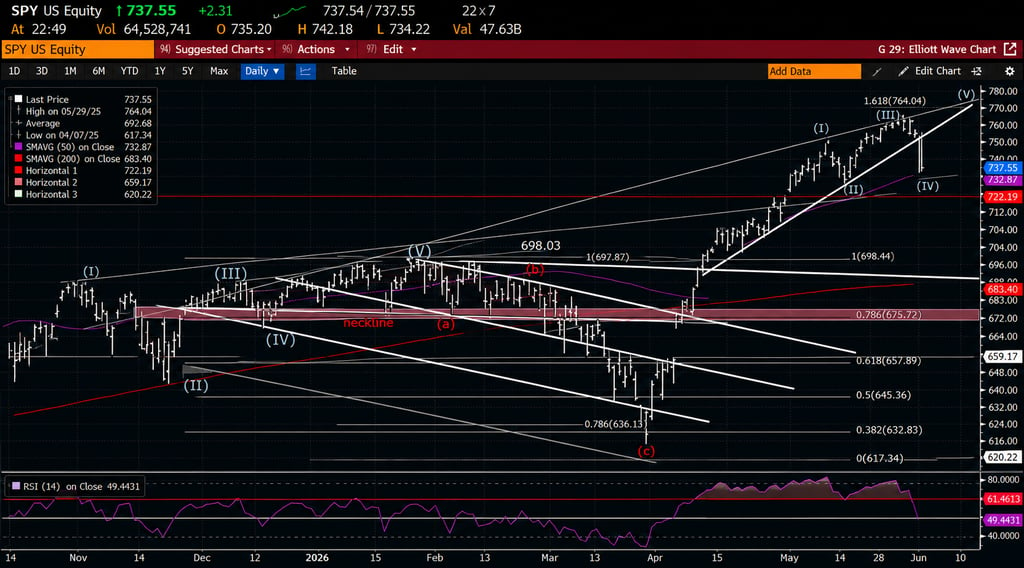
SPY has now delivered the first meaningful structural break after an extended advance that had become historically stretched. After nearly ten consecutive green weeks, the market finally rejected the upper extension zone near the 1.618 Fibonacci level at 764.04, failed to sustain above the rising wedge structure, and broke the steep trendline that had been supporting the final leg of the rally.
That matters because this was not a routine pause inside a clean uptrend. This was a failure at extension resistance followed by a decisive loss of short-term momentum. The key issue now is whether this decline is only a wave IV correction inside a larger bullish trend, or the beginning of a deeper mean-reversion phase. The answer will depend on how SPY behaves around the current support structure.
To get our live options trades as it happens each day sign up here
Price has already broken the aggressive rising trendline from the May advance, but it has not yet destroyed the entire larger bullish structure. That distinction is important. A trendline break tells us momentum has shifted. A breakdown through deeper support confirms sellers have taken control of the broader structure.
The first major downside zone is 737–735, where price is currently testing the lower channel and recent reaction area. If SPY stabilizes here and reclaims 740, then a reflexive bounce can develop. That bounce could target 744–746, then 750, but traders should not confuse a bounce with a full repair.
After a move this sharp, countertrend rallies are normal. The real test is whether buyers can reclaim broken support and hold it, not whether they can produce one strong green candle.
The first bullish repair trigger is a reclaim of 740, followed by acceptance above 744–746. If SPY can reclaim that zone and hold it, the market can attempt a larger bounce toward 750–753.53. The 753.53 gamma flip is especially important because price remains far below it. As long as SPY trades below that gamma flip, the market remains in a negative gamma regime, meaning volatility can stay elevated and directional moves can accelerate. A bounce under the gamma flip is still only a countertrend rally inside a damaged tape. The bearish trigger is failure below 737–735. If SPY cannot reclaim that zone, or if any bounce into 744–746 gets rejected, then the next downside magnet becomes 730.16. That level is important because it aligns with the 0.236 retracement zone and prior demand shelf from the early May structure. A move into 730 would likely be the first major area where dip buyers attempt to defend the market aggressively.
If 730.16 fails, the correction becomes much more serious. Below 730, SPY opens the door toward 722.19, which is the next major horizontal support and structural level on the chart. That would also represent a deeper unwind of the parabolic move from April. In that scenario, the market would no longer be digesting gains; it would be actively repricing risk.
Help
Questions? Reach out anytime here
Contact
Subscribe TO WEEKLY NEWSLETTER
support@daytradersgroup.com
© 2026. All rights reserved.