SPY's 668 Pivot Tested : The Gamma & Structural Triggers That Will Dictate the Next Leg
Last week we were unequivocal: 668 was the level that mattered most.With SPY trading near 690, we repeatedly emphasized that the daily chart was constructing a clear corrective architecture pointing directly toward the 0.618 Fibonacci retracement at 668.68.
SPY PRICE FORECASTTECHNICAL ANALYSIS
The Day Traders Journal
3/7/20263 min read
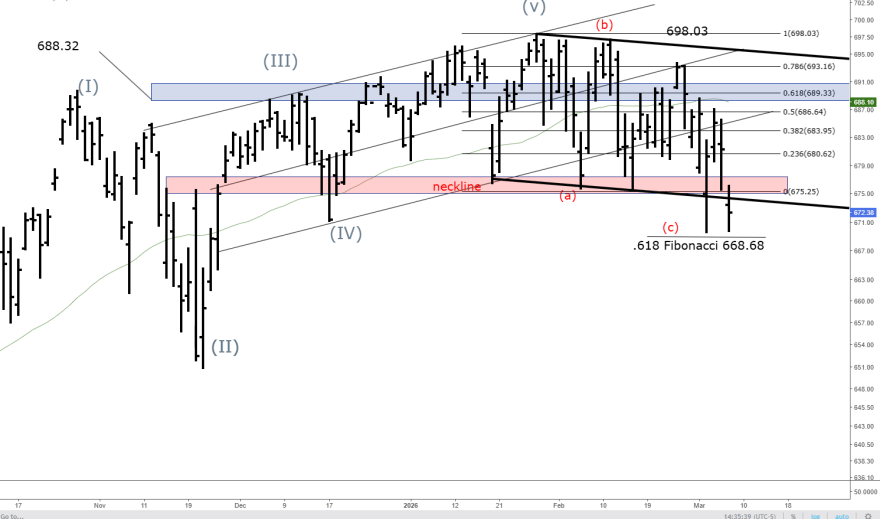
Last week we were unequivocal: 668 was the level that mattered most.With SPY trading near 690, we repeatedly emphasized that the daily chart was constructing a clear corrective architecture pointing directly toward the 0.618 Fibonacci retracement at 668.68. That confluence, where the projected wave (c) target aligned with the lower boundary of the developing descending wedge, the neckline extension, and a prior liquidity pocket, was not arbitrary. When multiple independent technical factors converge at a single price zone, the market frequently turns that area into the decisive battleground for the next directional phase.This week delivered precisely what we anticipated.SPY printed an intraday low of 669.66 (March 5 session), effectively tagging the 668.68 target to within a few handles. The level held as temporary exhaustion, producing a reflexive bounce that has carried price back into the 676-678 region as we head into the close. This reaction is textbook: deep Fibonacci and structural support zones often generate sharp counter-trend recoveries before the larger trend reasserts itself.
The daily chart now shows a completed A-B-C corrective pattern from the (V) high at 698.03:Wave (a) : sharp decline to the neckline.
Wave (b): counter-trend rally into the 693–695 supply shelf.
Wave (c): final thrust lower, terminating at the 0.618 extension (668.68).
The RSI(14) on the daily timeframe has rolled over decisively, now trending lower from overbought territory and printing a series of lower highs, clear evidence that upside momentum is eroding after months of grinding higher. On the shorter 5-period RSI (visible on your intraday chart), we see oversold readings during the flush to 669, followed by a curling recovery, classic divergence that supports the reflexive bounce but does not yet signal a trend reversal.Volatility is expanding (VIX now comfortably above 25), which historically marks the transition from range-bound compression to directional expansion. The quiet, grinding advance of recent weeks has given way to larger swings, precisely the environment where high-conviction directional trades begin to emerge)
The zero gamma flip remains firmly anchored around $693.23 ( EOD reference, consistent with quant feeds clustering $686-$690). SPY closed well below this threshold ($676-$677 range), confirming we are operating deep in negative gamma territory:Net GEX, Heavily negative (estimates -$2B to -$4B+ range, put gamma dominant).
Put wall/magnet, Stacked at 675-676, which acted as temporary support fRIday but cracked on volume.
Call wall/resistance, Concentrated at $688-$690, capping bounces aggressively.
Trigger levels and likely outcomes:Below $675 (neckline close), Negative gamma hedging accelerates. Path opens to 660-665 (measured extension symmetry, prior swing lows, volume voids), high-probability exhaustion zone if momentum carries.
Reclaim & close above $689, Regime flips positive. Triggers short-covering squeeze toward 690–693 (channel upper rail, 0.786 retracement convergence), delays deeper correction, forces reassessment of bearish count.
Hold 676-678 into close, Maintains compression. Favors another probe lower tomorrow (672-670 retest likely) before any sustained bounce attempt.
The Path AheadThe 668 zone has served its role as the first major pivot. The market is now compressing between firm support at the neckline (675) and resolute resistance at the gamma flip ($689). Whichever level breaks first will dictate the next multi-day leg:Sustained hold above 675 + reclaim of $689 = reflexive rally into 690–693 symmetry zone (wave 4 extension, potential wave 5 top).
Decisive close below 675 = acceleration toward 660-665 (deeper corrective thrust, next major liquidity pocket).
This is the exact environment where disciplined traders thrive: clear levels, high-leverage inflection points, and expanding volatility creating outsized reward-to-risk setups. We will continue tracking these triggers in real time during live sessions, delivering timestamped alerts, key entry/exit levels, and high-probability trade structures as they develop.Stay sharp, manage risk tightly, and let price confirm direction at these zones. The structure is resolving, we need only remain patient and precise.As always, the live trading room remains the place for real-time discussion, alerts, and execution of these setups. 50% off first month still active, join us inside if you’re ready to trade the move as it unfolds.
Help
Questions? Reach out anytime here
Contact
Subscribe TO WEEKLY NEWSLETTER
support@daytradersgroup.com
© 2026. All rights reserved.